
Soybeans Hit The Short Term Target, Now What?
Soybeans
This was the analysis sent out on 8/7/25 to our Premium Members.
This week's analysis is below.
8/7/25
September
From last week,
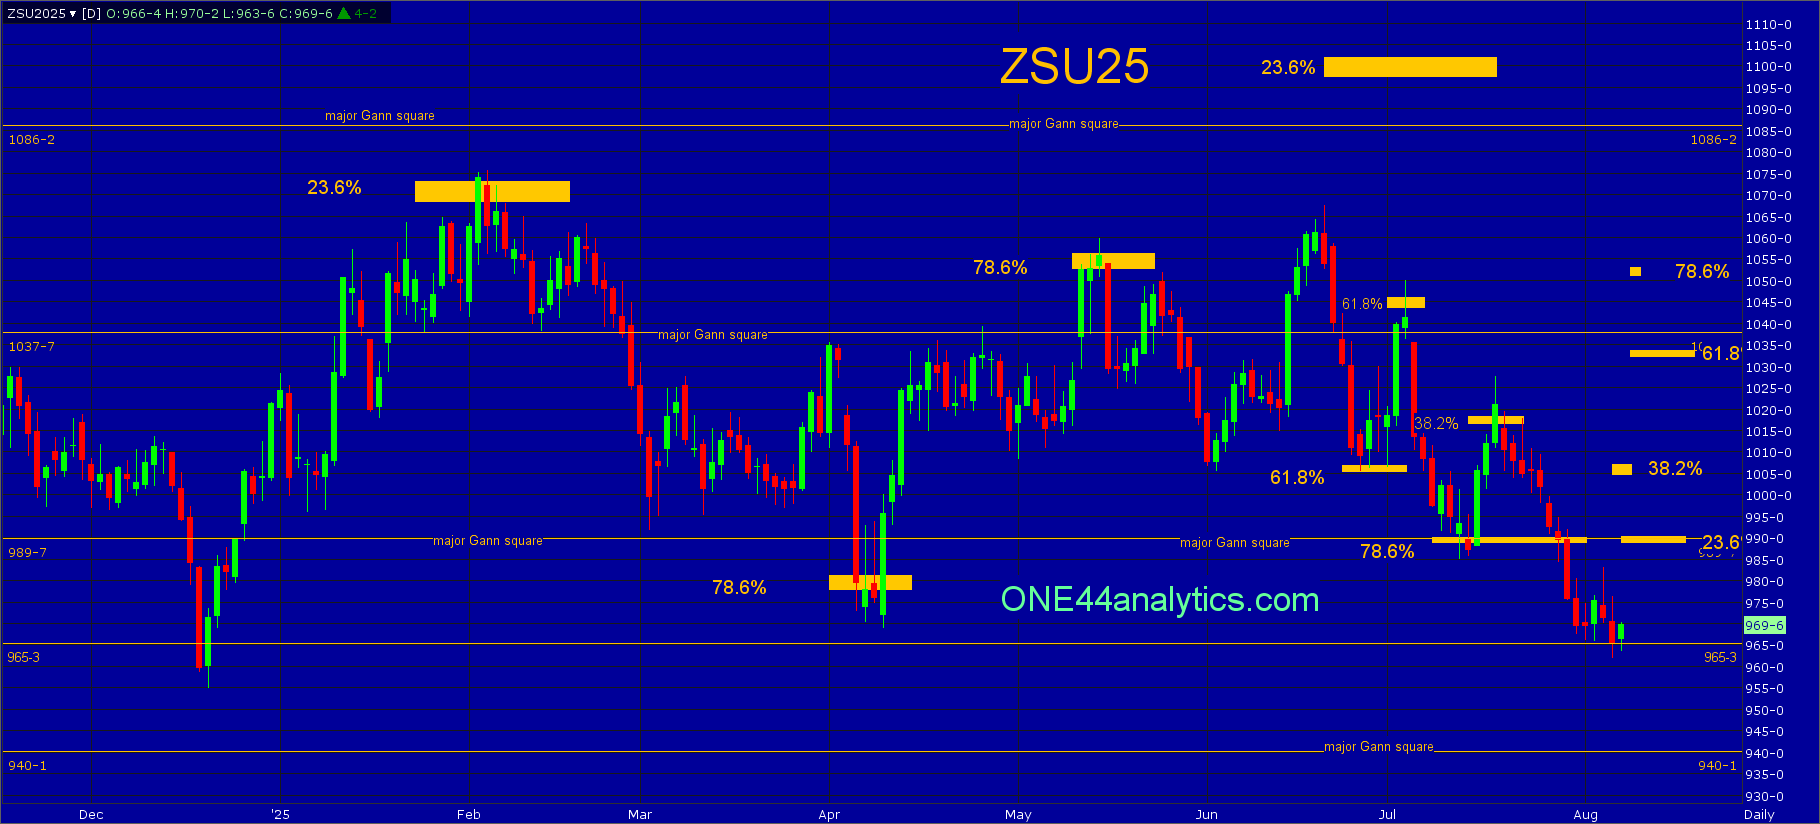
Use the 989.75 major Gann square as the swing point for the week.
Below it, there are only major Gann squares to look for support and then use as the swing point when closed below, the next three are 965.25....
This week's low traded below the 965.25 major Gann square, but as of yet has not closed below it and this will be the key level for the next week.
Use 965.25 as the swing point for the week.
Above it, the short term target is 38.2% back to the 2/5/25 high at 1005.00. The longer term target area is 61.8% of the same move at 1032.00 and the 1037.75 major Gann square. Any rally that can't get above 23.6% at 989.75 is a very negative sign and a new low can quickly follow, this is also a major Gann square.
Below it, there are only major Gann squares to look for support and then use as the swing point when closed below, the next two are 940.00 and 913.75.
November
From last week,
The failure to get above 38.2% at 1027.00 ended up sending this market to a new low. It hit not only the short term target of 1008.00, but today it is currently trading below the longer term target of 78.6% at 993.00 and this will be the key level for the next week. November continues to trade sideways and is building a very big base between the 961.25 and 1057.50 major Gann squares for what we think can be the next Bull move, as always we will be watching all the retracements above for the first sign of a breakout.
8/21/25
Soybeans
This will be the last update for September.
From last week,
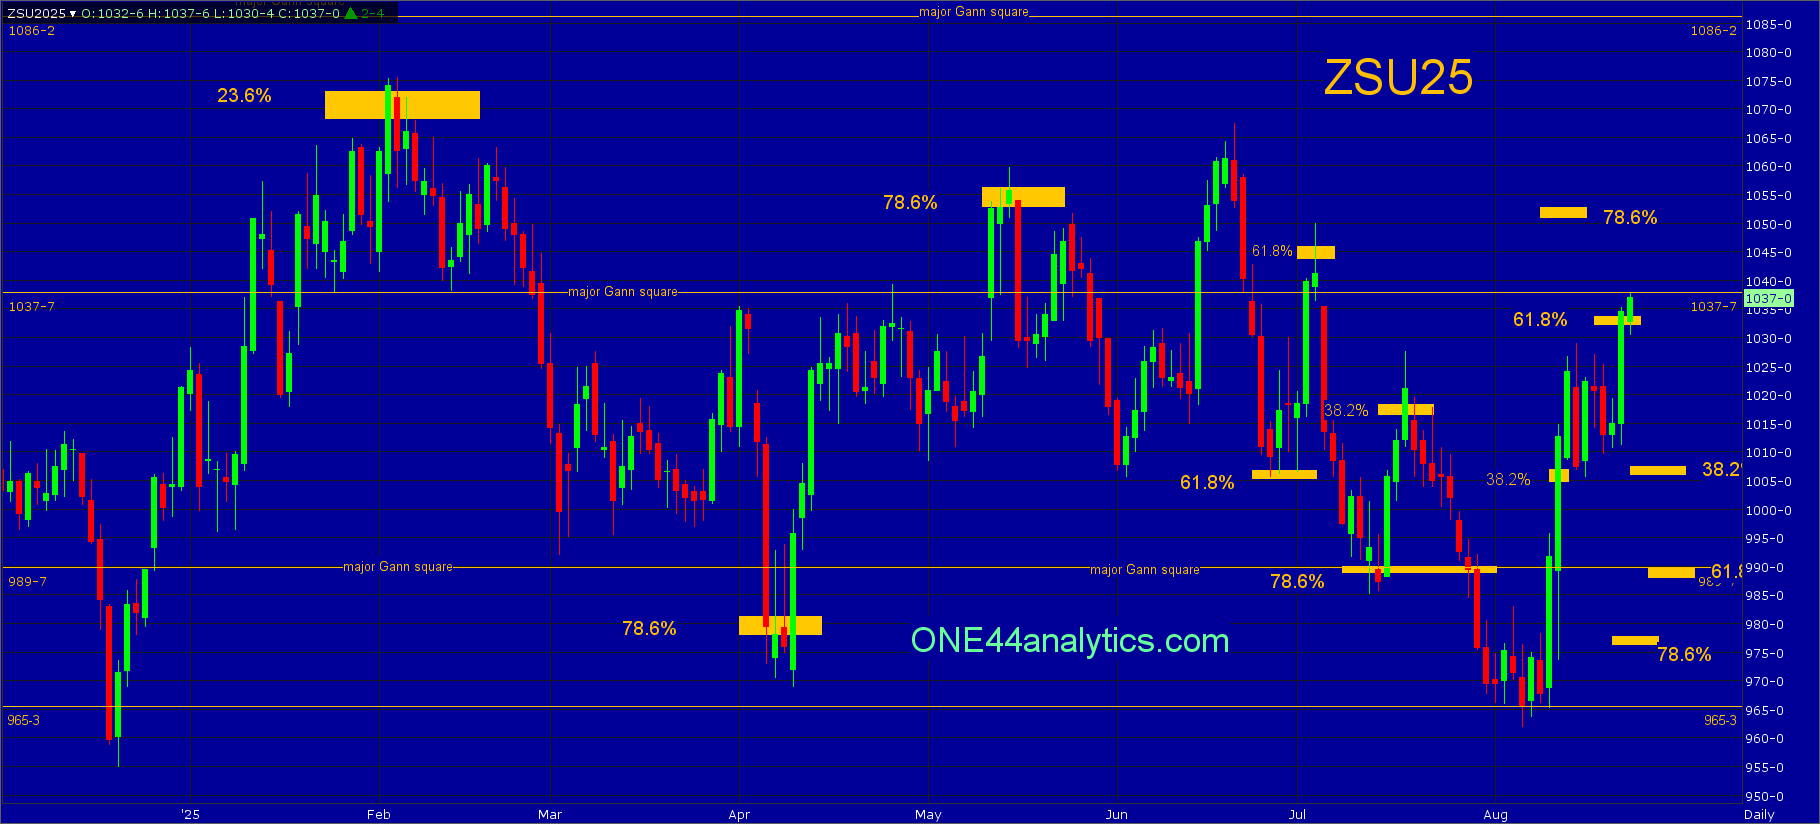
The low last Friday was 965.25 and the rally took it through the short term target of 38.2% at 1005.00 and this turned the short term trend positive. We will now use 38.2% back to the 8/6/25 low at 1002.00 as the key level for the week.
Use 1002.00 as the swing point for the week.
Above it, keeps the short term trend positive and the short term target area is 61.8% at 1032.00 and the 1037.75 major Gann square. The....
After the big rally in the previous week the market consolidated the last five trading days above the 1002.00 (38.2%) swing point for the week keeping the short term trend positive. Today's high hit the short term target area of 1032.00 to 1037.75. With 1032.00 being 61.8% it will be the key level for the week and we will use the ONE44 61.8% rule for the longer term downside target.
Use 1032.00 as the swing point for the week.
Above it, you still have to watch for a trade up to, or above the 1037.75 major Gann square and a close back below 1032.00 as this can cause a quick selloff. The short term target is 78.6% at 1051.00. The long term target area is the 1086.25 major Gann square and 23.6% on the continuation chart at 1097.00.
Below it, the short term target is 38.2% back to the 8/6/25 low at 1007.50, holding this keeps the short term trend positive and a new high can quickly follow. The longer term target is 61.8% the other way at 989.75 per the ONE44 61.8% rule, this is also a major Gann square.
ONE44 Analytics where the analysis is concise and to the point
Our goal is to not only give you actionable information, but to help you understand why we think this is happening based on pure price analysis with Fibonacci retracements, that we believe are the underlying structure of all markets and Gann squares.
If you like this type of analysis and trade the Grain/Livestock futures you can become a Premium Member.
You can also follow us on YouTube for more examples of how to use the Fibonacci retracements with the ONE44 rules and guidelines.
Sign up for our Free newsletter here.
FULL RISK DISCLOSURE: Futures trading contains substantial risk and is not for every investor. An investor could potentially lose all or more than the initial investment. Commission Rule 4.41(b)(1)(I) hypothetical or simulated performance results have certain inherent limitations. Unlike an actual performance record, simulated results do not represent actual trading. Also, since the trades have not actually been executed, the results may have under- or over-compensated for the impact, if any, of certain market factors, such as lack of liquidity. Simulated trading programs in general are also subject to the fact that they are designed with the benefit of hindsight. No representation is being made that any account will or is likely to achieve profits or losses similar to those shown. Past performance is not necessarily indicative of future results.